Stitch Visibility
What's really going on in there?
One of our summer interns, Max Packer, describes his summer project of improving visibility into the inner workings of Stitch.
Overview
This summer I worked on a number of projects related to Stitch, Amperity’s identity resolution engine. Before I get into those projects, I want to give a quick overview of how Stitch works.
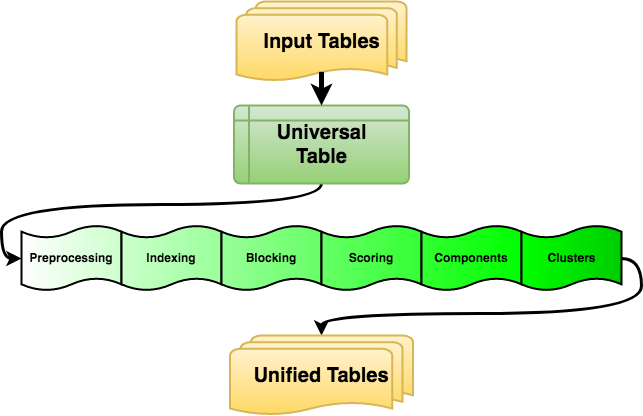
The basic goal of Stitch is to take in a bunch of records of customer data (usually from multiple different sources) and assign an ID to each one, where if two records share the same ID it is because we think they represent the same person. First we preprocess the data, which does things like normalize the address so that every letter is uppercase, “ST” gets expanded to “STREET”, etc. This ensures that every record is using the same format and makes it easier to compare two values.
Given a pair of two records, we have a classifier that can assign a “score” to that pair representing how likely these two records are to be the same person. However, we often work with over a billion input records, which translates to about a quintillion possible pairs. Clearly, naïvely checking every single one is not going to work. Instead, we run every record through a number of “blocking functions” - functions that map an input record to a set of strings, known as “blocking keys” - and only consider pairs of records that have at least one blocking key in common.
These functions can be as simple as returning all email addresses associated with that record (so we check all pairs with an email in common) or they be a more complicated combination of a record’s values. In any case, after blocking, we end up with a narrowed down list of potential pairs which we then score with the classifier, retaining only those pairs that score above a certain threshhold. Considering these pairs as edges of a graph, we then get the connected components, and then we perform hierarchical clustering on each component to remove any bad transitive links this creates.
Runtime
It is easy to tell how long Stitch as a whole takes; just subtract the start time from the end time. But Stitch is composed of many different stages, and overall runtime does not give a good sense of which stage or stages the problem is in. Moreover, figuring out how long each stage takes is more complicated than one might think, because Stitch runs on Apache Spark which is lazy (i.e. does not actually do any data transformation until it is forced to be realized by some downstream use), and on many different machines in parallel, so it is hard to understand exactly how much time is spent on a specific transformation.
So, instead of statements to record the time at the start and end of a section of code, I added these statements directly into the most expensive transformations, so we could be sure that the work was indeed happening exactly when it claimed to be. However, many of these transformations happen on every single input record, and reporting the time in every single transformation would overload the system, so I had to narrow it down.
At first, I tried probabilistically reporting an event a certain percentage of the time, but this was confusing because sometimes we are transforming every single input record and sometimes are transforming a relatively small number of components, so the probability would need to change for different transformations. To get around this, I instead reported an event for a certain percentage of partitions, which are the smallest unit of data Spark operates over. Some transformations run billions of times and some run only thousands, but the number of partitions stays fairly constant through the job - we just have more or less data per partition.
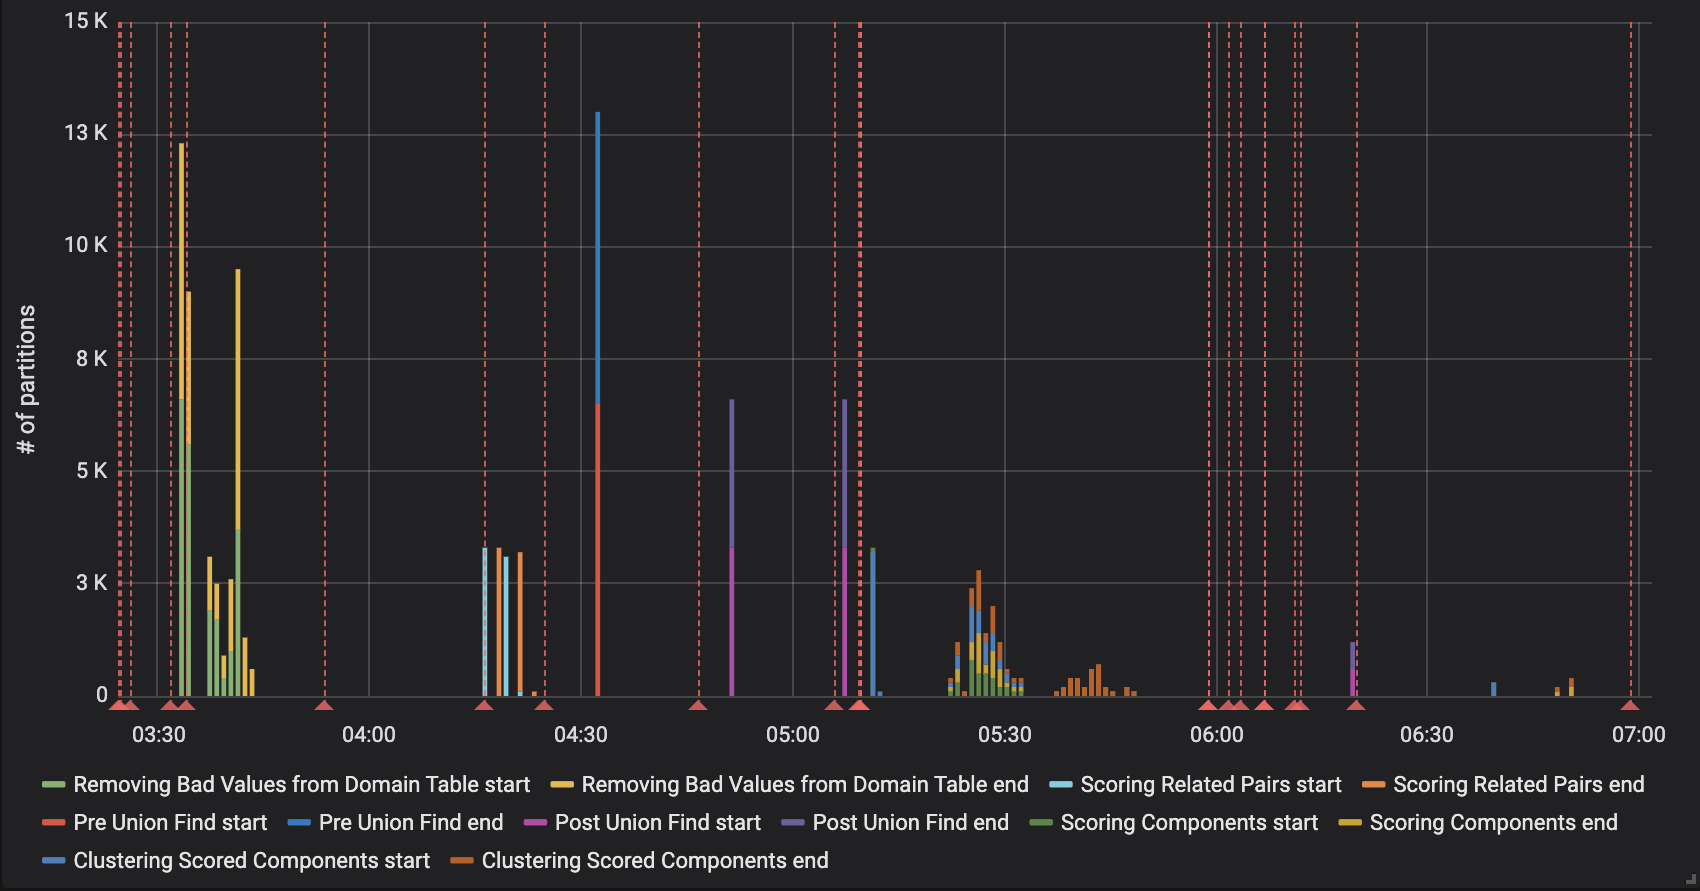 From these events I created a graph so that a confused developer could see at a glance which operations happened at what time.
Blocklisting
If there are input values you want to ignore, Stitch allows you to configure a blocklist. Any input record with a value on this blocklist will be treated as if that value was left blank. We want to expose this information to customers so that they can easily tell which emails, phone numbers, addresses, etc. are bad values. Previously, this was done outside of Stitch by comparing the table of input records against the blocklist and seeing if anything matched. There are a few problems with this, including:
- In Stitch, we compare values against the blocklist after preprocessing both the input data and the blocklist data. This means that if, say, a record has an address of 123 MAIN ST when 123 MAIN STREET is on the blocklist (or vice versa), Stitch would ignore it, but we wouldn’t report it as blocked.
- In the blocklist, we specify a certain data source that a specific blocklist entry applies to. So, if something was on the blocklist for a different data source, but not for the one it came from, we would indicate it was removed when it was not.
- Malformed values are ignored even though they aren’t on the blocklist. There are also certain values that are always removed no matter the provided blocklist. It would be more useful to know whether a given value was bad for any reason than just if it was on the blocklist.
The fix to all of these was fairly straightforward intuitively. We already output the data for each record after preprocessing and applying the blocklist - I could simply compare the input data to this preprocessed data and indicate that, say, an email was removed if it was present in the source data but not present after preprocessing. However, there were a number of edge cases to consider.
We allow multiple phone numbers, multiple emails, and multiple addresses, so I had to count up the number of each both before and after preprocessing and indicate whether the count decreased. To make matters worse, counting the number of addresses proved fairly complicated as each address is represented by multiple fields both before and after preprocessing. In the end, these columns were fixed and now accurately represent whether a record had any addresses/emails/etc. removed, making it much easier for implementers and customers to diagnose the impact of bad values on their Stitch results.
Blocking keys
When we are doing QA on Stitch and find two records that we think should have ended up together but did not, or vice versa, we want to be able to know exactly which part of the process caused this. We were already writing out information for each input record on which connected component it was in, which “trivial dupe group” it was a part of (two records are “trivial dupes” if they are semantically exactly the same - same email, name, phone number, etc.), and which “supersized component” it was a part of, if any (supersized components are connected components that are too big for hierarchical clustering, and so are broken apart in a faster way beforehand).
This allows us to paint a pretty good picture of the path that a record takes through Stitch. For instance, if two records have the same component ID but different final IDs, that means they were broken apart in hierarchical clustering. If two records have the same supersized ID but different component IDs, that means they were broken apart in partitioning the supersized component. However, there is a key piece of information missing - were two records even blocked together in the first place?
If two records should have been joined but didn’t make it to the same component, is this because they didn’t get blocked together or because they scored below the threshhold? If two records should not have been joined but were in the same component, is this because they got blocked together or because they were transitively linked when forming connected components?
I added an option to write out all the blocking keys as well, and created a table that puts all this internal information together in one place, so that we can easily answer questions like these. Also, with the blocking key data accessible, we can more easily determine how useful each blocking function is for a certain dataset, and use that to better inform which ones we should be using.
Reflections
I wasn’t sure what to expect coming in, as this was my first software internship and also my first time using Clojure. I can certainly say, though, that learning a new programming language is nothing compared to learning the structure and idiosyncracies of an existing codebase. Getting up to speed was difficult but rewarding, and I’m very grateful for the chance to contribute to a real world project, learn from lots of smart people, and just generally have fun. Big thanks to Joe, my mentor, for being extremely helpful and supportive, and to everyone else I’ve had the chance to work with over the summer. It’s been great!