Distributed Data Flow Scheduling and Monitoring
At Amperity, our services process terabytes of data across dozens of large brands every day. Our systems ingest raw data in various formats from many locations, perform intelligent identity resolution, generate custom databases with customer profiles and send data to customer systems of action and analytics.

To make sure we process data quickly and in a cost effective way, we use workflows. Each workflow is a logically continuous flow of data through different stages of data processing until the final desired result reached. In this post we will review how Amperity approaches setting up the data flows and how we monitor them to make sure all data is processed in every run of each workflow.
Integration with Airflow
Currently our data flow schedule leverages Apache Airflow. We have a custom service – called
glow – that acts as a translation layer between Apache Airflow and the rest of the Amperity
application. Our decision to leverage Airflow was based on the fact that it provides basic workflow
logic in a form of a DAG (Directed Acyclic Graph), and represents a collection of tasks to run
organized based on relationships and dependencies. Airflow also provides a web-based user interface
that our team leverages to review constructed DAGs, monitor the status of currently running flows,
and perform operational tasks such as pausing and restarting tasks in data flows. With Airflow
providing core support for scheduling and monitoring the workflows, we are able to focus our efforts
on establishing the best ways for our internal services to configure workflows and react to task
completion or failure. The services maintain configuration and parameters of each workflow in each
customer. Every minute or so, the glow service retrieves configurations for all active customer
accounts and constructs the DAGs necessary to run their data flows.
Data Flow Scheduling
The Amperity application allows customers to start workflows manually and to schedule them. When customers start workflows from the application, the operations are run by the Amperity services as soon as possible. Scheduled workflows are driven via configuration stored for each customer. The glow service checks each customer’s configuration and retrieves schedules for all customer workflows. Then it defines DAGs corresponding to workflows which include all tasks needed to be performed on data. When it’s time to run, the glow service kicks off DAGs in Airflow. Below is one example of this interaction.
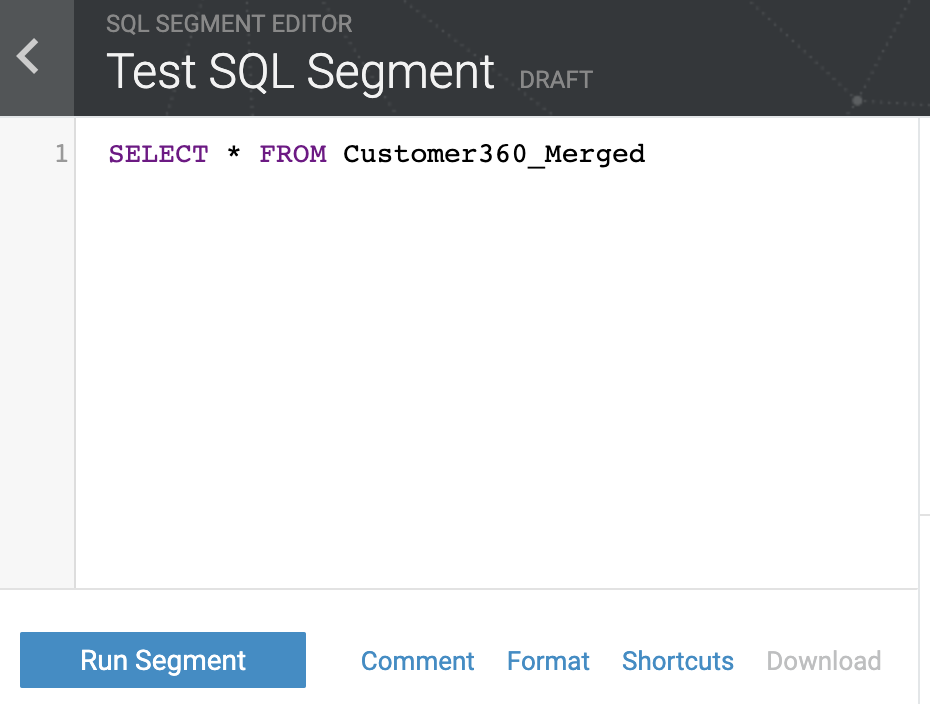
Segments are one of the core concepts in the Amperity application and they enable businesses to identify interesting groups of users (or statistics about them) to use for direct marketing or deriving insights. Here is an example of a SQL query used in defining a segment.
While the Amperity application allows customers to run segments and download results, the primary use for segments is to setup a regular upload of segment results into various customer systems of action and analytics. Customers can configure the desired destination as shown below.
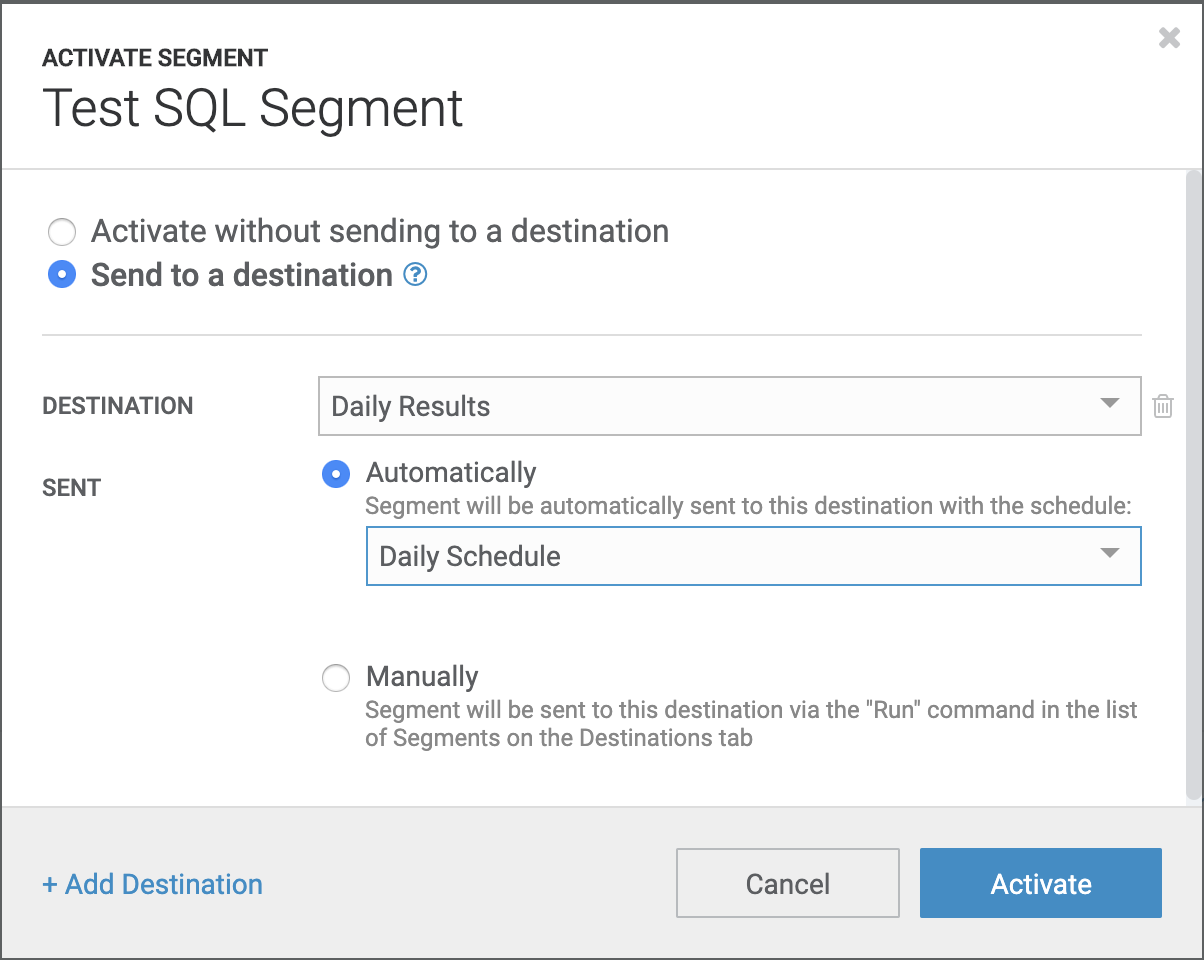
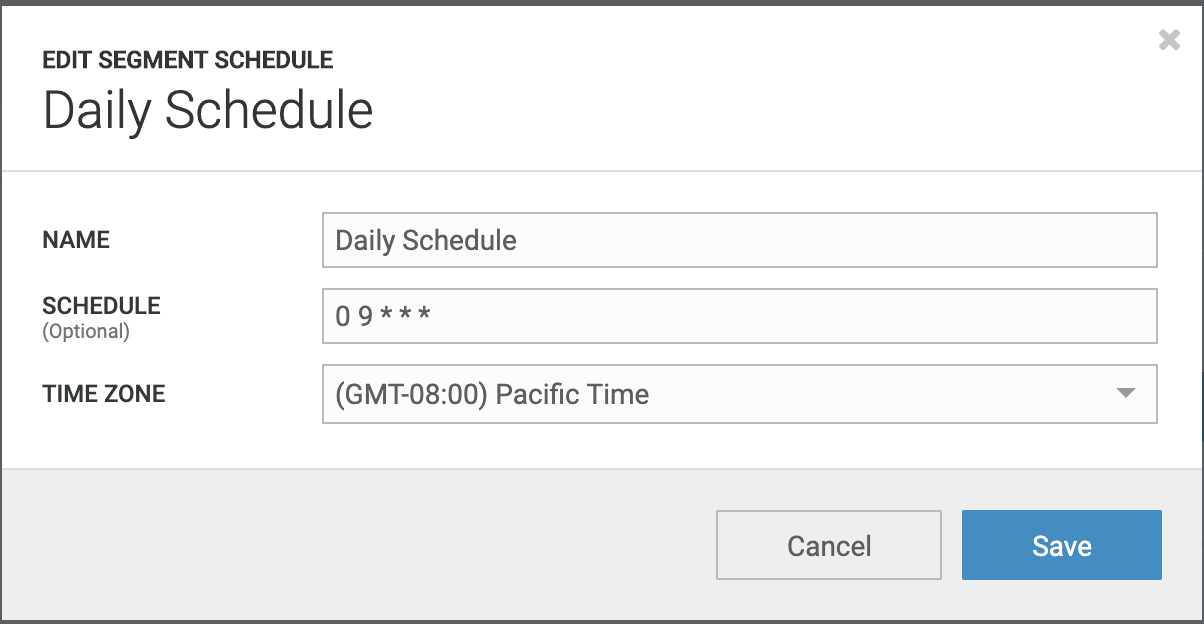
Customers can configure the desired schedule for results to be uploaded into their configured
destination. Below is an example configuration for sending results of the
Test SQL Segment daily at 9:00 am Pacific Time which respects Daylight Time Savings change.
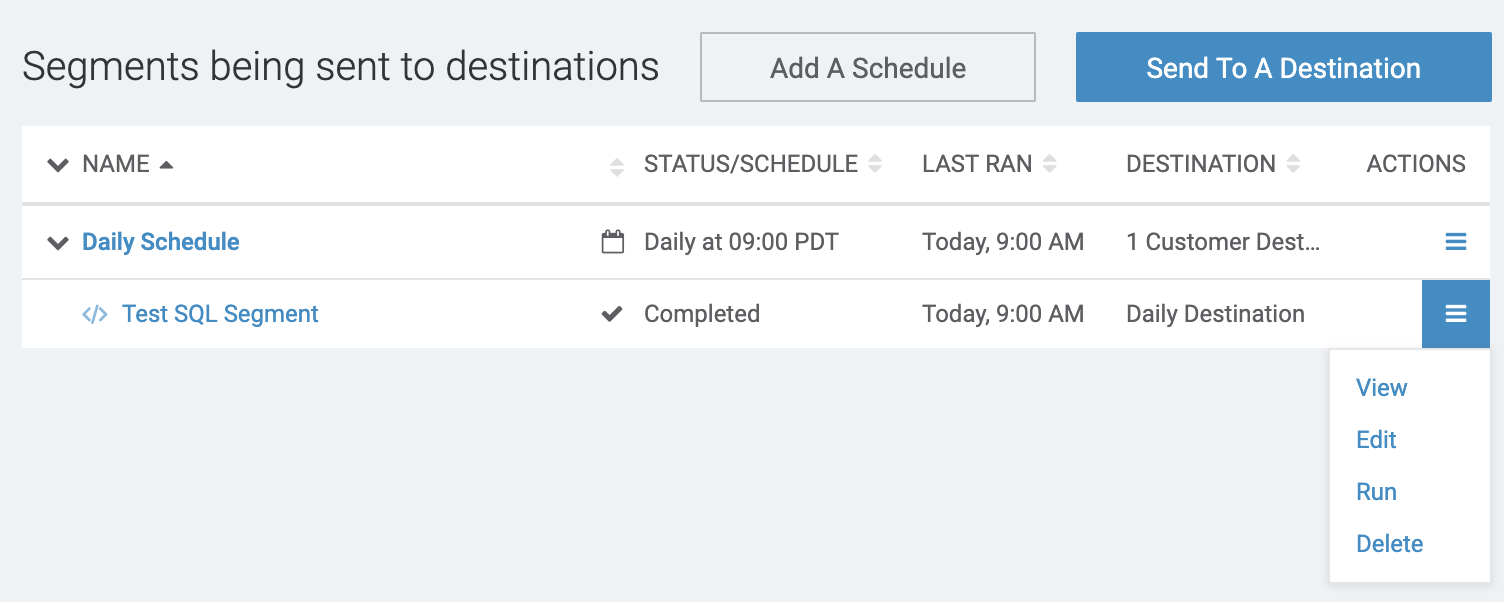
Customers can manually request results to be sent to a destination by selecting the Run option in
the application menu.
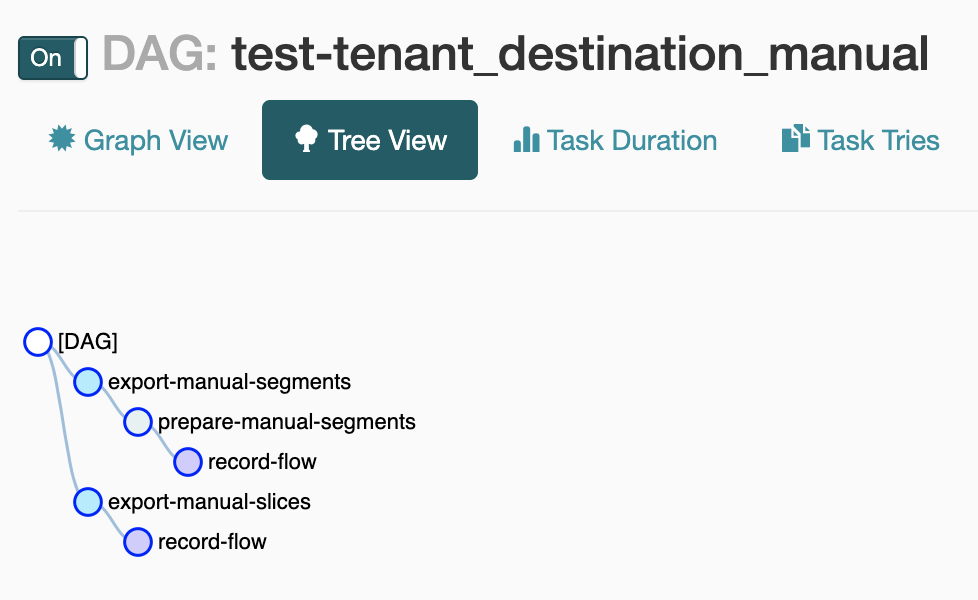
Further discussion of details in segments and destinations configurations is beyond the scope of this post. Instead, let’s take a look at the details of scheduling. Every minute or so, the glow service checks every service for updated configuration. Once the glow service detects a new destination configuration, it creates a new DAG in Airflow with a collection of tasks needed to ensure the data is generated and sent to a destination. Here is the DAG prepared by the glow service in Airflow for manual upload of the results from the test SQL segment shown previously.
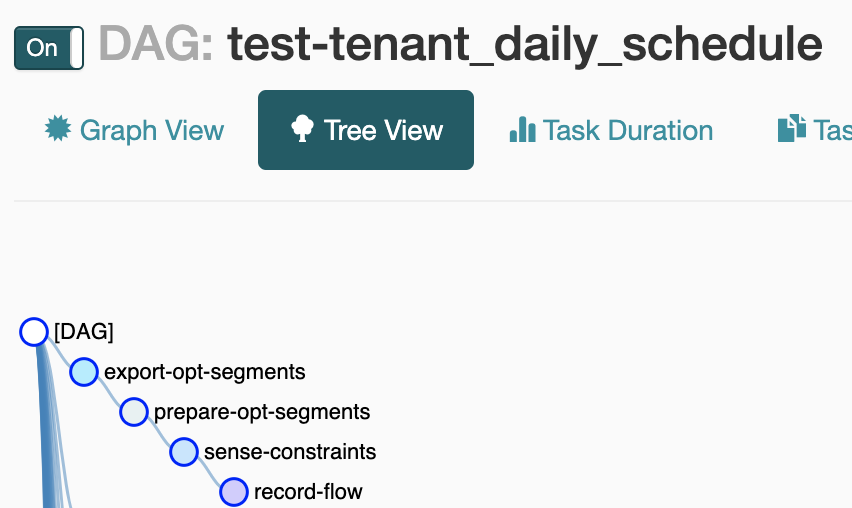
Here is the part of the tree in the DAG prepared by the glow service in Airflow for daily scheduled uploads of the results from the test SQL segment example from above.
When it is time to run a workflow for delivering results from this test SQL segment to the configured destination, the glow service requests that Airflow run the corresponding DAG and monitor it by periodically checking its status in Airflow. As the DAG status changes, the glow service sends progress notifications to other internal services over our internal deployment of Apache Kafka. The processing details of these events is not in scope for this post, but it’s something we will cover in future posts.
SLA Data Flows
A number of the scheduled data flows for each customer correspond to critical business processes.
Typically in these scheduled data flows, the Amperity services process customer data for the time
period between consecutive runs and produce results our customers expect to receive on a strict
timeline. We call these workflows the SLA flows (Service Level Agreement). Our monitoring tools
closely track the SLA flows to ensure successful and timely completion. There are two major types of
SLA data flows. The first type are those that extract customer data from its original location, load
it into Amperity’s internal data storage, and then start all tasks required to perform identity
resolution, deduplication and other data transformations of the data received. The second is writing
results of data processing from Amperity’s internal storage to customer provided data output
locations, which are variations of the example with the test SQL segment described previously.
Using our internal tool called admin-repl, we can retrieve the status of the SLA workflows
scheduled to be run at a given time, which we reference as a schedule window in the following
report generated by (sla-summary). Here an example of how such textual report looks like.
[prod] amperity.repl.admin=> (sla-summary)
2019-05-22T14:00:00.000Z wsw-20190522-36009-7nG7m         tenant-01 open        SLA
2019-05-22T12:00:00.000Z wsw-20190522-28808-4zoXKs        tenant-02 succeeded   SLA
2019-05-22T14:00:00.000Z wsw-20190522-36009-7BSTTJ        tenant-03 succeeded   SLA
2019-05-22T07:00:00.000Z wsw-20190522-10804-6iiUae        tenant-04 open        SLA
2019-05-22T11:00:00.000Z wsw-20190522-25203-7JBGRg        tenant-05 open        SLA
2019-05-22T16:00:00.000Z wsw-20190522-43202-6Ac7Rd        tenant-06 open        SLA
2019-05-22T07:00:00.000Z wsw-20190522-10804-4GPq5b        tenant-07 succeeded   SLA
2019-05-22T13:00:00.000Z wsw-20190522-32405-5kTRB5        tenant-08 open        SLA
If a workflow is marked as succeeded, then all tasks in it completed and results were delivered
to the customer specified destinations. If it is open, then some parts of the daily flow have not
completed yet. We have commands to drill down into each schedule window such as (sla-report) and
each workflow such as (flow-report) to give the team full visibility into each workflow and each
task in workflows.
Data Flow Monitoring
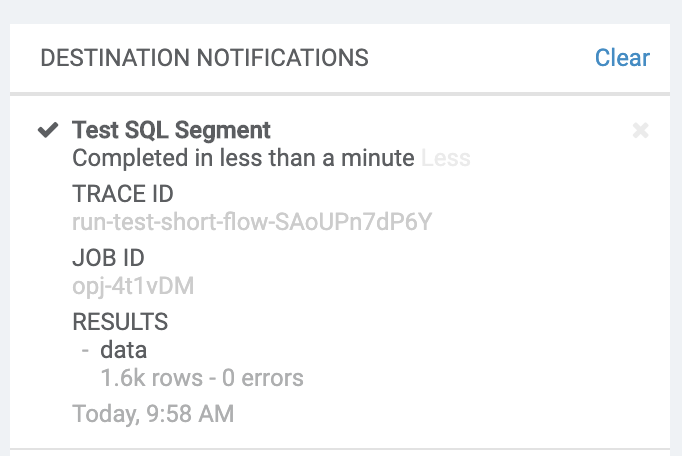
As mentioned earlier, while DAGs are running in Airflow, the glow service checks on the status of each workflow and publishes status updates as events in Kafka. Internal services react to these events in real-time to perform necessary operations. Such updates are also shown to customers in the Amperity application on the notification tab. Here is an example of a notification shown in the application for the test SQL segment results upload.
In the case of SLA flows, our internal monitoring tools make sure that each flow started when expected and it makes progress as expected. If any task within the flow failed or if the flow got interrupted in any other way, our internal tools raise operational alerts to notify the team. Leveraging history of past runs of this data flow in this tenant, we also monitor for abnormal duration of each task. If a particular task run duration is detected as anomalous (for example, running much longer than typical with consideration of the prior consistency), we review the status of the flow, understand the delay and attempt to put a remediation to ensure the data flow completes on schedule.
This concludes our brief introduction into how Amperity organizes processing of data in workflows, and how we approach scheduling and monitoring. If you would like more details about any part of the system discussed in this post, please send us your comments over email or on Twitter.